
The City Beneath the City
プロンプト
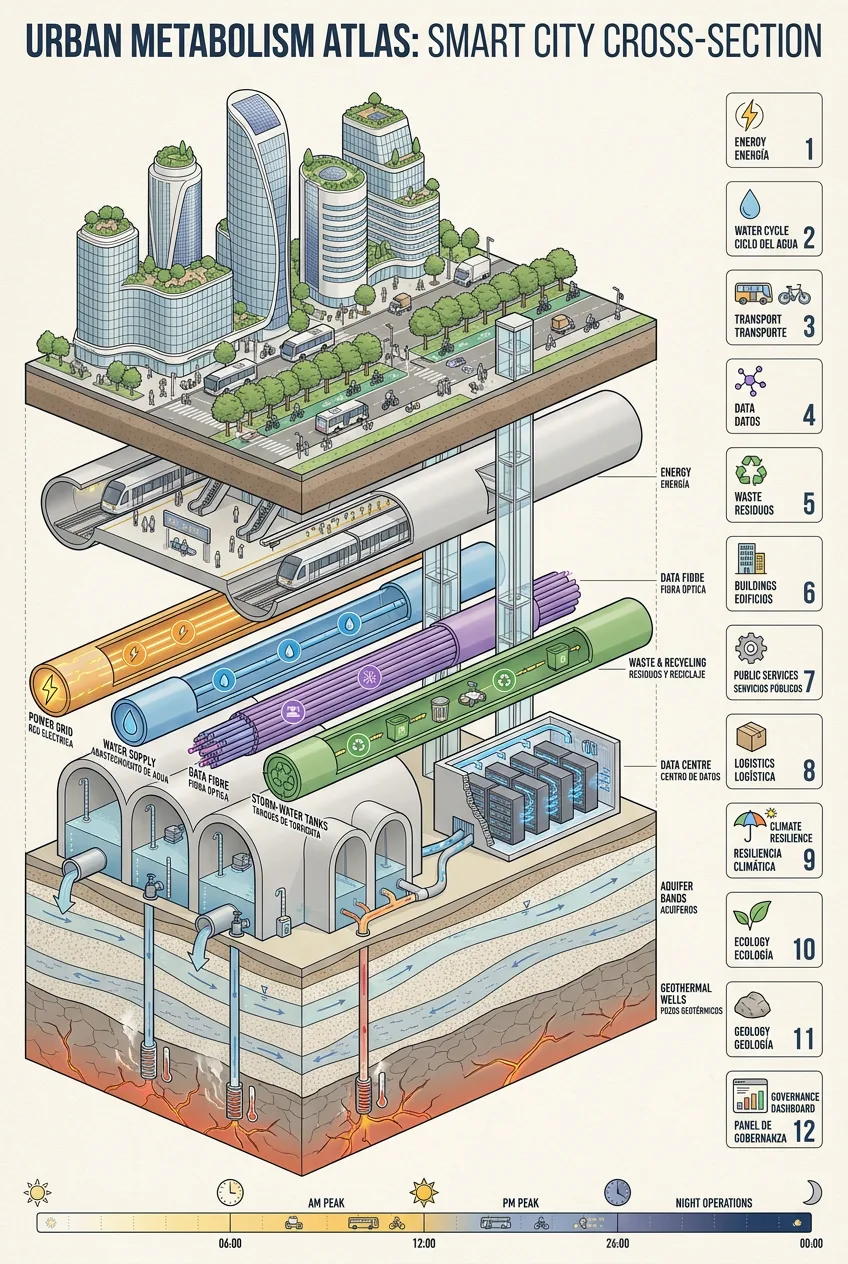
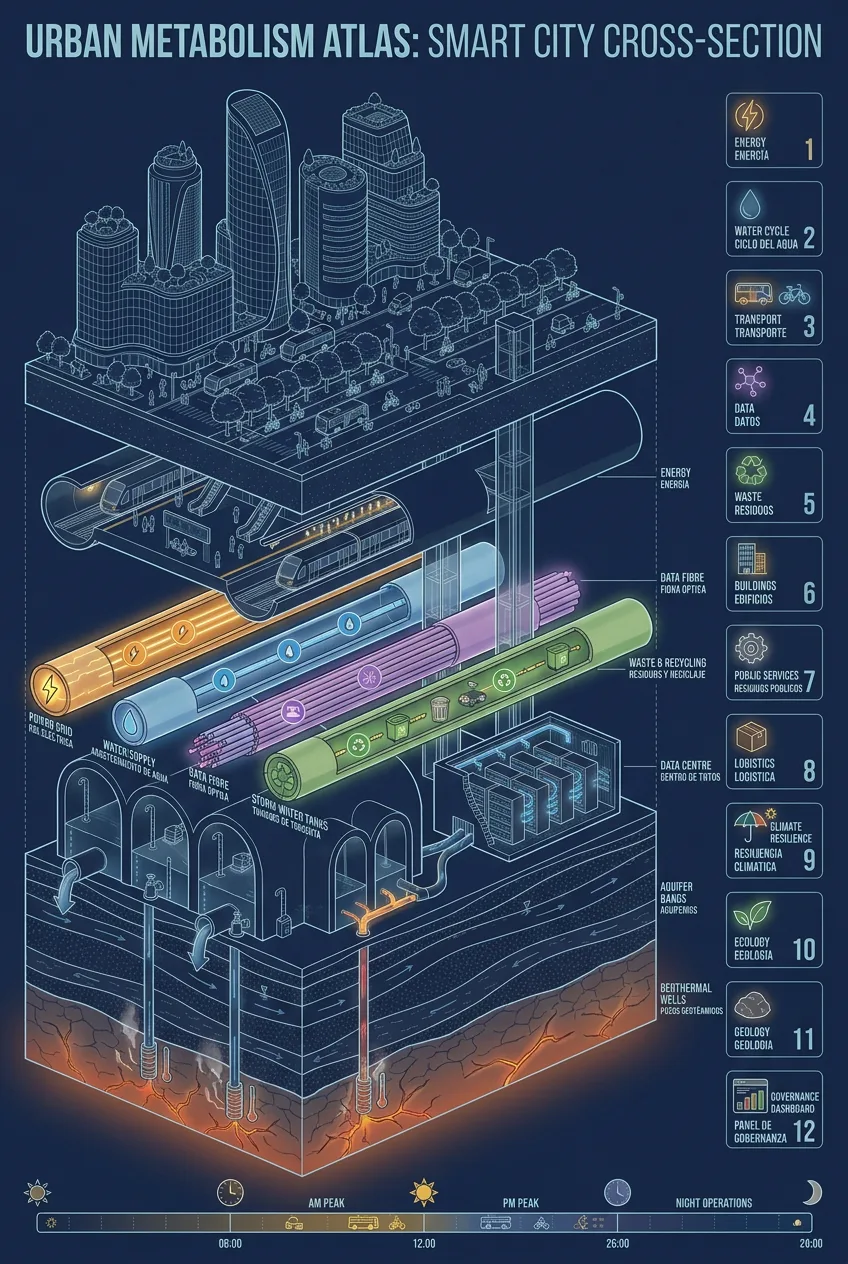
A vertical isometric cutaway infographic of a smart city shown as one tall stacked cross-section, titled in the concept of an urban metabolism atlas: at the top, a cluster of elegant skyscrapers with rooftop gardens and solar skins, streets with tiny buses, cycle lanes and tree rows at surface level; directly below the pavement, a bright subway level with a rounded train tunnel and a station box; deeper still, a utility stratum of parallel service tunnels carrying colour-coded flows, amber for power, blue for water, violet for data fibre, green for waste and recycling; below that, storm-water flood tanks like underground cathedrals, a compact data centre in a cooled vault, pale aquifer bands with slow groundwater arrows, geothermal wells drilling to a warm fractured bedrock base. Twelve small numbered side panels in two tidy columns summarise energy, water cycle, transport, data, waste, buildings, public services, logistics, climate resilience, ecology, geology and a governance dashboard, each with one tiny icon and a short bilingual label. A slim 24-hour timeline strip runs along the bottom with sun and moon markers. The drawing style is a crisp engineering white paper crossed with a scientific atlas: light warm paper background, fine ink outlines, restrained flat colour with gentle isometric shading, generous margins, everything aligned to a strict grid. Flat even illumination, soft drop shadows separating the strata. Labels stay minimal, short and perfectly legible, numbers large and clean. Ultra-detailed vector finish, print-poster quality, no photography, no people, no cyberpunk styling anywhere. Tiny elevators, escalators and delivery robots are drawn at miniature scale inside the section so the whole system feels alive and operational rather than diagrammatic.
プロンプト詳細
| 推奨モデル | Nano Banana Pro |
| アスペクト比 | 3:4 |
| 商用利用 | 可 — 生成物のライセンスは使用モデルの規約に従います |
このプロンプトが効く理由
Subject: A vertical isometric cutaway atlas of a smart city, from skyscrapers above ground down through subway and utility tunnels to aquifers and bedrock. Composition: One tall stacked cross-section, twelve small numbered side panels, a 24-hour timeline strip along the bottom. Camera: Clean isometric projection, engineering-plate framing. Lighting: Flat even illustration light, soft shadows under each stratum. Material: Crisp vector lines on light paper, colour-coded flows for power, water, data, traffic and waste. Style: Scientific atlas meets engineering white paper. Guards: Minimal short labels only, no gibberish, no cyberpunk, no watermark.
プロンプトの使い方
- プロンプトをコピー
- 上に表示されたモデルを開く
- 生成する
出典:PixAttic Studio(オリジナル)。集約エントリーでは必ず元の作者をクレジットし、出典ポストへリンクします。 DMCA · 報告・削除リクエスト
Prompt adapted and expanded from @null · via PicGens. All images on this page were generated by PixAttic Studio using the prompt above.